The data presented below was collected by running tests between 3 different pairs of machines, kalim (my desktop) and xander (my laptop), kalim and moxie, and moxie and lambda. Tests were run in both directions, excepting the kalim-moxie pairing, as kalim is behind the CTS firewall.
The graphs presented below follow this color scheme: red = kalim to xander (where X to Y denotes X = client and Y = server), blue = xander to kalim, green = kalim to moxie, orange = moxie to lambda, and cyan = lambda to moxie.
Here's the data:
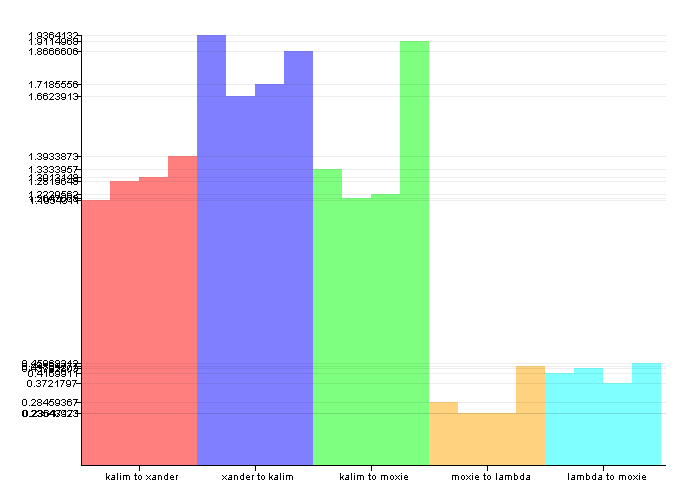
The following graph depicts the RTTs (in milliseconds) for the various pairings. The first column for each pairing is for a 1 byte message, followed by 4 bytes, 16 bytes, and 256 bytes.
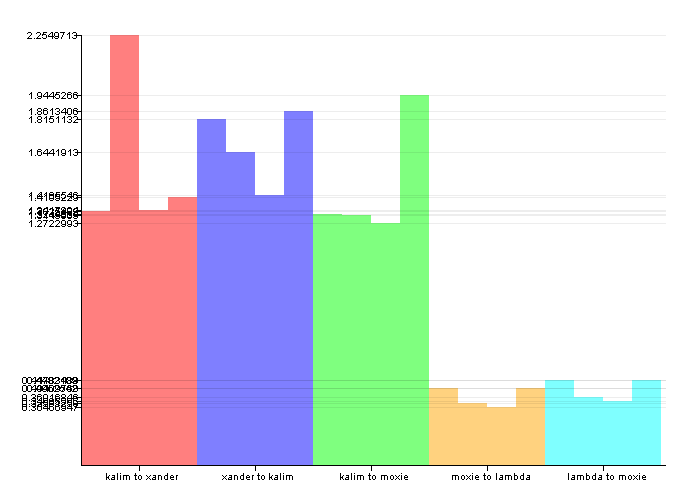
The following graph depicts the RTTs (in milliseconds) for the various pairings. The first column for each pairing is for a 1 byte message, followed by 4 bytes, 16 bytes, and 256 bytes.
The following graph depicts the throughput in Mbps for the various pairings. The first column for each pairing is for a 1KB message, followed by 4KB, 16KB, 256KB, and finally 1MB.
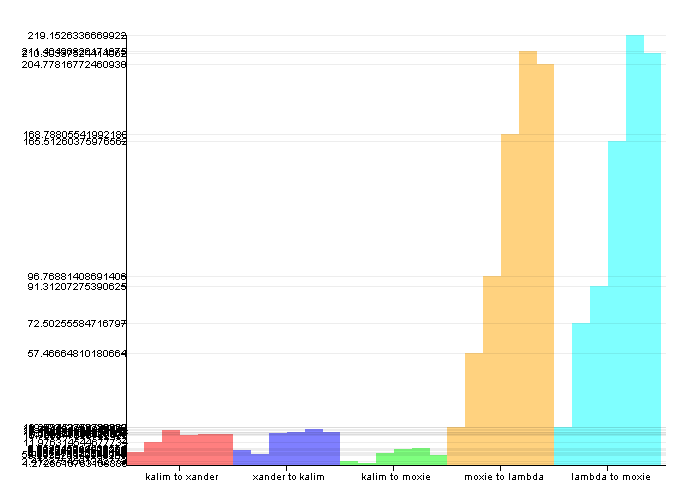
The following graph depicts the throughput in Mbps for the various pairings. The first column for each pairing is for a 1KB message, followed by 4KB, 16KB, 256KB, and finally 1MB.

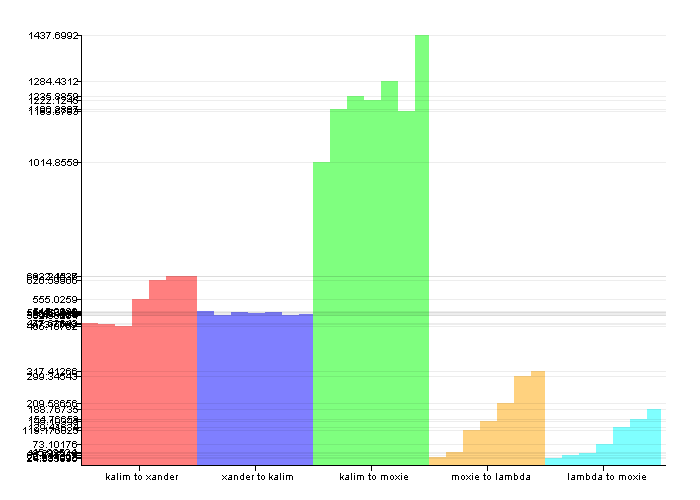
The following graph depicts the amount of time (in milliseconds) to transmit a 1MB message over TCP using different message sizes, for the various pairings. The first column for each pairing is for a 4KB message size, followed by 2KB, 1KB, 512B, 256B, 128B, and finally 64B.
-->Jake Peck, 20120219
Code and Raw Data:
NetTestApp.java
data.txt
To compile:
javac NetTestApp.java
To run (server):
java NetTestApp Server
To run (client):
java NetTestApp Client <hostname>